One of the central lessons I have learned from my time in the Skeptic community is that the veracity of information isn’t the primary factor in determining what people accept as true. Some groups have known this for a very long time. The practices of the advertising and marketing sectors are largely determined, whether they realize it or not, by the psychology of belief. In our highly connected, ad driven world, the importance of how to use the largely unconscious factors that affect attention and acceptance is central to success. This has worked its way into almost every aspect of our lives. One of my favorite science YouTube channels recently did a video about some of the things that affect the popularity of a video and interactions with the algorithm that determines how often that video is presented and to whom. The subject has also come up in print as various science communicators talk about the importance of headlines and the way they present information. As all of these people get better and better at presenting information in a way that appeals to our psychology they are able to make content that is more convincing and more likely to “go viral”. I see this as a significant, and essentially ignored, danger. People can be wrong. The more expertise you have in a field the less likely you are to be wrong. This is a particular danger in science communication. The material is often quite subtle. Without sufficient expertise in the subject material, it is likely that the message will misinform as much, or even more, than inform. This is fairly well understood and recognized, at least in the abstract. As Neil deGrasse Tyson put it recently in the ad for his MasterClass: “One of the great challenges in life is knowing enough to think you're right but not enough to know you're wrong”. As science communicators get better and better at presenting their material in a convincing manner the material is more likely to stick in people’s memories. When they present incorrect information, in this more convincing manner. their audience accepts it and remembers it even better. Let’s consider a specific, quite narrow, topic: waste from Thorium reactors. The amount of misinformation on this subject is enormous. I’ve seen trusted science communicators assert that the waste from thorium reactors is far less radioactive and has a shorter half-life than that of current reactors. This is not only wrong, it reinforces a fundamental misunderstanding of the subject. If something is less radioactive it has, by definition, a longer half-life. That’s simply what the words mean. It is impossible for something to be both less radioactive and have a shorter half-life. The half-life is the length of time needed for half of the sample to decompose due to radioactive decay. A substance with a very long half-life is very difficult to distinguish from one that is not radioactive. This mistake is often made in the opposite direction. You will see pronouncements about the danger of “highly radioactive materials with a long half-life”. Such materials, by definition, can not exist. One science communicator, popular among skeptics, explained that material in a thorium reactor is “completely burned” so it “has had almost all its radioactivity already spent”. As if radioactivity is a substance that is released in nuclear reactors. Not only is this not the way it works, it encourages people to think of reactors in ways that are simply wrong. Such misinformation can only make things worse. When that misinformation is skillfully communicated it does so to a greater extent. I have written about this type of problem before. That post was about the use of “whiz-bang” visuals, one of the many ways a video is made more appealing. So what can be done? A simple, fairly effective solution is both obvious and not practical. Restrict science communication to people that are true experts in the field being communicated. Another, slightly more practical option, is to get science communicators to confirm what they say with subject matter experts. Yet another option is for topics, like the characteristics of spent fuel from thorium reactors, which need lots of background information to be comprehensible, to be out of bounds for science communicators
Friday, December 17, 2021
Wednesday, November 10, 2021
Nuclear Waste as Nuclear Fuel? Not really.
I keep running across the assertion that nuclear waste can be used as nuclear fuel. In several cases it is asserted that it is only regulations that prevent this use. One went so far as to say "[W]hat’s the difference between nuclear fuel and nuclear waste. The scientific answer is really nothing, there is no difference. The only difference is a technological one. Nuclear fuel is radioactive material we know how to burn as fuel and radioactive waste is nuclear material we don’t know how to burn as fuel but there is no other real, physical difference between fuel and waste. It’s a technological difference only."
The quote in the previous paragraph is simply false. As will be explained below, nuclear waste, no matter what reasonable definition you use, contains a significant amount of material that cannot be used in a nuclear reactor. For the rest of this I'll address the more reasonable versions of the assertion.It is helpful to think of two types of fuel, active fuel and potential fuel. Active fuel undergoes a reaction that releases large amounts of energy, allowing the reactor to generate power. Potential fuel undergoes a reaction (or reactions) that convert it to an active fuel. In our day to day world only active fuel is thought of as fuel. Most current nuclear reactors use U-235 as active fuel and in normal operation almost all of it is used up. At the same time a small amount of the U-238, acting as potential fuel, is converted to Pu-239 that then acts as active fuel. All of the uranium originally put into the reactor is fuel but the vast majority is potential fuel and only a small amount of that either starts as or can be converted to active fuel in current reactors. It is sometimes said that the only difference between nuclear fuel and nuclear waste is the type of reactor it is used in. If by "fuel" we mean active fuel, which is the only kind we are familiar with in normal life, this is simply wrong. It is possible to build reactors where virtually all of the potential fuel is converted to active fuel but those reactors are complex and expensive and they require a large amount of complex processing to get anywhere near this point. It should also be noted that these future reactors can NOT be operated using only what we now call waste (more detail below). New, active fuel is needed.
The first problem is that the term "nuclear waste" means entirely different things to different people. For this discussion we'll be considering "spent nuclear fuel". This is a small fraction of the radioactive material produced in a reactor and is the only really problematic material short of a nuclear accident.
For this discussion we can consider most nuclear fuel as just a mixture of two isotopes of uranium. The majority is U-238, about 95% of it. It is potential fuel so it cannot take part in the power generating nuclear reactions. The rest, about 5%, is U-235. This is the active fuel that produces the desired energy in the reactor.
When the spent nuclear fuel is removed most of the U-235 has been used up, it is now <1% of the material. It is converted to what are called fission byproducts. This consists of a wide range of material, some quite radiologically hazardous, but for considerations of use as fuel it is worthless. Some of it is worse than useless. It will absorb neutrons, suppressing the desired nuclear reactions. It is truly waste. A small amount of the U-238 has been converted to plutonium, mostly Pu-239 with a smaller amount of Pu-240 and other isotopes. In total about 1% is plutonium. Some of the uranium is also converted to other uranium isotopes.
The claim that spent fuel is reusable is based on reprocessing. The idea is that by a variety of processes the spent fuel can be separated into components and then placed back into the reactors that it came from. Often the claim is made with numbers attached. Most commonly I've seen it as something like this paraphrased example: "Only around 5% of the energy available in nuclear fuel is extracted in our current reactors. 90% of rest could be extracted if the fuel were reprocessed".
The 5% number should sound familiar, it is the original amount of U-235. The other 95% is based on the idea that the U-238 can also be used as a nuclear fuel.
This is almost correct if we are careful when we talk about what kind of fuel we mean and, more importantly realize that it requires a type of reactor that is different than essentially all of the ones currently in use. The fact these issues are almost never mentioned when the claim is made is what makes the claim so misleading.
To understand this better a bit more background is required. All of the reactors in this discussion are fission reactors. Nuclear fission occurs when a neutron is absorbed by a nucleus and that nucleus splits, roughly in half, and often emits a number of neutrons. There are many isotopes that will undergo fission but the important subset for this discussion are those that emit enough neutrons when they fission that a chain reaction is possible. These are called fissile materials. There are only a few such isotopes and three of them are most important for nuclear power: U-233, U-235 and, Pu-239. Of these only U-235 exists in any noticeable amount in nature. But there isn't much, it is just 0.7% of natural uranium. The remaining 99.3%, is essentially all U-238.
Most power reactors use uranium that has been enriched in U-235 to about 5%. This is done by separating out almost pure U-238, increasing the proportion of U-235. The separated material is known as depleted uranium. Enrichment is done so that the neutrons released by the fission are likely enough to reach another U-235 nucleus and cause a sustained reaction. This results in the 95% U-238 mentioned above. As mentioned above, the operation of the reactor results in some Pu-239 being created, some of it used as active fuel but about 1% of the the spent fuel is plutonium.
The transformation from the potential fuel, U-238, to Pu-239, is a multi-step process.
U-238 + neutron → U-239
U-239 decays to Np-239 (half-life of about 25 minutes)
Np-239 decays to Pu-239 (half-life of about 2.5 days)
Near the end of the useful life of the nuclear fuel a significant fraction of the energy comes from the fission of Pu-239. It is possible to design a reactor to optimize the production of Pu-239. These are called "breeder" reactors and they produce more active fuel than the active fuel they consume. Breeder reactors sound too good to be true. Producing more fuel than is consumed doesn't seem possible, but it is. That's one of the problems with this entire topic. So much of what happens is so far outside of the intuition developed in our day to day world that we are often lead to conclude things that aren't true.
As an interesting aside, the oft mentioned Thorium reactor is also a breeder. Here Th-232 is a potential fuel that goes through a similar (but slower) multi-step reaction to produce the active fuel U-233, the third fissile isotope.
Current reprocessing of spent fuel produces, among other things, MOX fuel. These are Mixed OXides of uranium and plutonium, current reactors can use this material as a minority of its fuel. Almost all of this is produced by combining plutonium from reprocessing with depleted uranium. Depleted uranium is used because the uranium obtained from reprocessing (RepU) contains various impurities that impede the nuclear reactions and other negative consequences that are beyond the scope here. This is in direct contradiction to the common assertion that this MOX fuel is composed mostly of the reprocessed material and results in more of the potential fuel being used.
In conclusion, there is a lot of misinformation about nuclear power and so called "nuclear waste" much of that misinformation greatly exaggerates the dangers and problem. But a significant amount is being spread by nuclear proponents. Whereas it is possible to process spent nuclear fuel and extract virtually all of the nuclear energy available in the uranium fuel (both active and potential) this is far more complex and expensive than is implied by proponents, it would require reactors that are significantly different than those in use today, and it would not use all of material as fuel.
Monday, July 19, 2021
Vaccination Fraction and the Base Rate Fallacy
I keep seeing references to the fraction of people with COVID related conditions that have been vaccinated. A recent story implied that the fact that about half of the infections in Israel were in vaccinated people was evidence that the vaccines aren't working. There is a nice post that looks at the stories about Israel. Half sounds like a lot only is you don't take into account the base rate of vaccination. Since 85% of the people have been vaccinated the fact that a far smaller fraction of the infected were vaccinated shows that the vaccines do work. Not taking the base rate into account, or deceptively not including it in the information provided, is the Base Rate Fallacy.
What is the relationship between vaccine efficacy, vaccination rate, and the fraction of those effected that are vaccinated? It turns out that it isn't as simple as you might expect.
Say the fraction of people that are vaccinated is v, and the fraction of illnesses the vaccine prevent is e. Then fraction of infected people that are vaccinated is:

Let's look at some examples. If we set both e and v at 0.85, meaning that 85% of the population has been vaccinated and that the vaccine is 85% effective in preventing disease. In that case the fraction of the cases that are vaccinated is expected to be just under half. For the current situation in the US let's take e=98% and v=30%. This gives us 0.008, which is a pretty good match for the oft repeated "99% of those hospitalized for COVID in the US have not been vaccinated".
I see a slight danger here. If we consider e=0.98 and v=0.5 we get 0.019. The vaccinated fraction more than doubles. The reason it goes up as the vaccination rate goes up is obvious, once it is pointed out. Take the extreme case, where everyone is vaccinated, v=1. Then the fraction of effected people that were vaccinated is also 100% since that's the only kind of people there are. This is the extreme case of the Base Rate Fallacy. I both hope and fear that when the US gets to v=0.5 we hear people using this doubling in the vaccinated fraction as evidence that vaccines aren't working. I hope for this because it will mean that v has gotten to 0.5 and I fear it will reduce future vaccinations. If we ever get to v=0.95 the fraction will be greater than 1/4, which will doubtless be trumpeted as a failure.
How do we get this equation?
Let's define some factors. Let's say that if G (for group) unvaccinated people are exposed we get Gc infections. That defines the degree of contagion c. If G vaccinated people are exposed there will be Gc(1-e) infections where e is the efficacy of the vaccine so we have a modified contagion factor of c(1-e).
If we have a group of N people then the number of cases expected in the vaccinated group, Cv, is Nv (the number of vaccinated people) times the modified contagion factor c(1-e).
The number cases in the unvaccinated group, Cu is N(1-v) (the number of unvaccinated people) times the contagion factor c.
So the fraction of cases that are vaccinated is the number of cases in vaccinated people divided by the total number of cases Cv/(Cu+Cv) or

There is a common factor of Nc so that cancels. So the number of people and the contagion factor don't enter into the final result. So we get:

We could also divide through by (1-e) and get the expression at the top.
Friday, July 2, 2021
The Analemma

.jpg)
That explains most of what's going on but you might think that the sun would just move up and down in a straight line. There are three reasons that this isn't the case. None are obvious without a fair amount of thought and only one is explained well, or even at all, in most treatments of the analemma.
First we need to talk about one of my favorite bits of pedantry. When asked what the length of a day is on Earth most people have no problem coming up with 24 hours. And that's right, or almost right. The problem is that there at least three kinds of days. For most planets, including Earth, the day is determined mostly by the rate at which it rotates. In fact, when you look up the length of the day for any planet other than Earth what you often find is the rotation period measured with respect to the distant stars. This is called the sidereal day and for Earth this is 23 hours 56 minutes 4.09 seconds (approximately). So why do we say that a day is 24 hours? Are we just rounding up? No, that's not what's happening. There is a kind of day that is 24 hours, or pretty darn close. But we aren't there yet.
When people think of the word "day" they think about the time the Sun is above the horizon. At first blush you might think that the length of time it takes for the sun to go all around the sky is one sidereal day. But it isn't. That's because as the Earth turns it also goes around the Sun. Since both of these rotations are in the same direction it takes a bit longer for the subsolar point to return to (near) the same spot than one sidereal day. To make this clear, look at this. (source: Wikimedia Commons):

But the Earth doesn't go around the Sun at a constant rate. It moves faster when closer to the Sun so it takes more time than usual to point back toward the Sun. This effect adds about 10 seconds to the length of a Solar Day in January and shortens it by about the same in June. This means that on some days it takes longer for the Sun to return to the same point in the sky, on others it takes less time. This produces side to side motion as seen in the analemma.


Let's look at a simple, but very exaggerated, situation. A planet with no axial tilt, a perfectly circular orbit, and a sidereal day 1/8 of its year. To start, as we did before, let's look from the direction of the Sun at local noon at the point with the red pole.


If we advance forward to one solar day from the starting point it looks exactly like the first image. This gives the expected behavior. As we go through the year after each solar day that Sun returns to the same point in the sky.
But things are different when there is an axial tilt. Here's a set of images that show the differences. The ones on the left are the same those above. The ones on the right show what happens with a tilt of 45°. Starting at the time of the southern summer solstice so the planet has the southern hemisphere tilted the maximum amount toward the sun.


Tuesday, June 15, 2021
Freezing, Magnetism, and Viral Spread
One of the things that I find most remarkable about science is how often disparate phenomena are connected in deep ways. The first two items in the title of this post are examples of a phase change. When the attractive forces between molecules, or the alignment of magnets, exceed the randomizing effects of temperature the system falls into a large scale order to form a solid or a ferromagnet.
There is also a strong mathematical connection to the epidemiology of a pandemic. The ability of an illness to spread is, in the abstract at least, just like the ability of magnets to align together or water molecules to freeze into a block of ice.
The study of phase changes is mathematically complex. One of the first, and simplest, techniques used to study this topic is called the Ising Model. It was constructed by Wilhelm Lenz in an attempt to model the formation of magnetic domains and assigned to his student, Ernst Ising. The model imagines a set of magnets that interact only with their nearest neighbor. Ising solved the simplest case, a one dimensional line, in his 1924 Ph.D. thesis, where he showed that there was no phase transition. He incorrectly concluded that the model was not able to produce a phase transition in any number of dimensions. The more complex two dimensional model was shown to have a phase transition by Rudolf Peierls in 1936 and solved by Lars Osanger in 1944. (The link in the previous sentence should not be followed by the mathematically timid) This shows a phase transition.
In its simplest form neighboring elements are given a probability of being aligned. Think of it as tiny magnets that have a tendency to face the same way but the random vibrations due to not being at absolute zero make this less than certain.


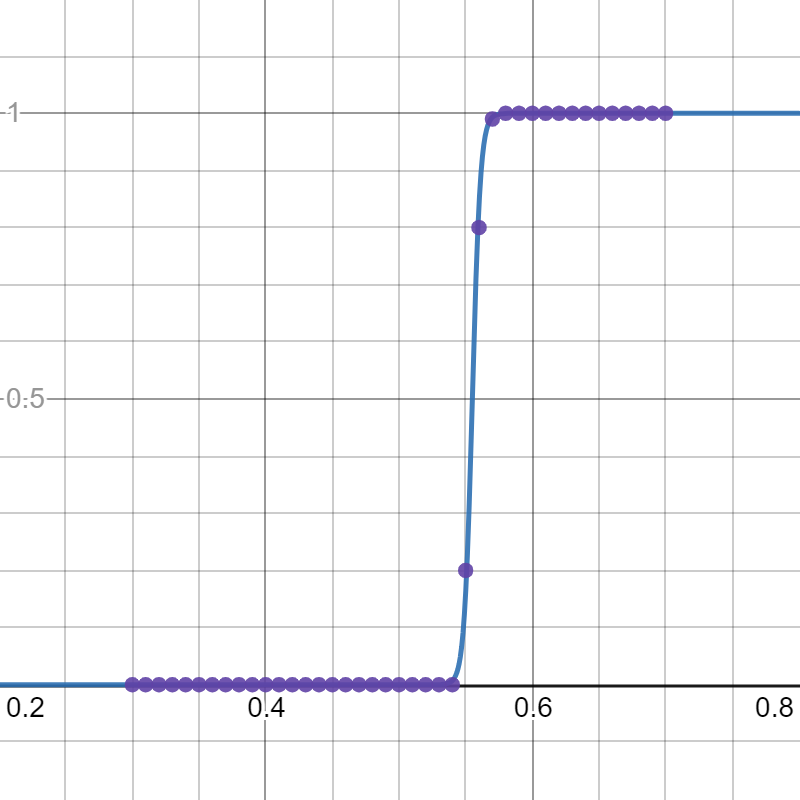
I've made an interactive webpage that shows a similar, but easier to compute system. Imagine a rectangular grid of points that can be connected by a pipe to the points on either side as well as above or below. Think of the top row as a source of water that can flow down, if the connections are there. The question is: Does the water make it to the bottom? Let's look at some examples to make it clear.


Friday, June 4, 2021
Decoherence, Measurement, and a Collapse of Understanding
I frequently find myself getting quite upset when reading articles about Quantum Mechanics (QM) in the popular press and related media. This subject is very hard to write about in a way that allows the reader to grasp the elements involved without inviting misconceptions. In many cases I think that these treatments do more harm than good by misinforming more than informing. I know of no way to quantify the misinformation/information ratio but my experience as a science explainer tells me that the ratio is often significantly larger than one.
I recently came across an article that tried to tackle some very difficult topics and, in my opinion at least, failed in almost every case and spectacularly so in a few. There are so many problems with this article I had a lot of trouble deciding what to single out but I finally settled on this:
"However, due to another phenomenon called decoherence, the act of measuring the photon destroys the entanglement."
This conflation of measurement and decoherence is very common and the problems with it are subtle. This error masks so much of what is both known and unknown about the subject it is doing a disservice to the reader by hiding the real story and giving them a filter that will almost certainly distort the subject so that when more progress is made the already difficult material becomes even harder to comprehend.
So, what are "measurement" and "decoherence" in this context and what's wrong with the sentence I quoted? I'm going to try to explain this in a way that is simultaneously, accessible without lots of background, comprehensive enough to cover the various aspects, and, most importantly for me, simple without oversimplifying.
"Measurement" seems innocuous enough. The word is used in everyday language in various ways that don't cause confusion and that is part of what causes the trouble here. When physicists say "measurement" in this context they have a specific concept, and related problem, in mind. The "Measurement Problem" is a basic unresolved issue that is at the core of the reasons that there are "interpretations" of quantum mechanics. There are lots of details that I'm not mentioning but the basic issue is that quantum mechanics says that once something is measured, if it is quickly measured again, the result will be the same.
That sounds trivial. How could that be a problem? What else could happen? It is an issue because another fundamental idea in QM is that of superposition: A system can be state where there are a set of probabilities for what result a measurement will get and what actually happens is random. The details of the change from random to determined, caused by a measurement, is not part of the theory. In the interpretation that is both widely taught and widely derided, the Copenhagen Interpretation, the waveform is said to "collapse" as a result of the measurement. To say that this collapse is not well understood is a major understatement.
In summary, a quantum "measurement" can force the system to change its state in some important way. To use examples that you've probably heard: Before a measurement a particle can be both spin-up and spin-down, or at location A and location B, or the cat is both dead and alive. After the measurement the system will be in only one of those choices.
The word "decoherence" is less familiar. It is obviously related to "coherent" so it is natural to think of it as a process where something is changed so that it loses some meaning. A good example would be a run on sentence filled with adjectives and analogies that go at the concept from so many directions that meaning is lost rather than gained. That is not what decoherence is about. To explain what it is I need to provide some details of QM.
Quantum Mechanics can be described as a theory of waves. The mathematical object that encodes everything about a system is called a "wavefunction". Waves are another concept that is pretty familiar. Let's consider something that is familiar to many people: a sine wave.


Sunday, April 11, 2021
The Fermilab Muon g-2 experiment
Most of you have probably seen a story or post about the Fermilab Muon g-2 experiment. I have two problems with the way this has been treated by most science popularizers.
In keeping with the worst features of pedantry I'm not going to give a good explanation of the experiment in this post, just complain about certain elements in the coverage. For an explanation that avoids the first problem try this.
The first issue is pretty straightforward and, in the spirit of this blog, rather pedantic. In an attempt to explain what the experiment is measuring many stories describe gyroscopic precession as a "wobble". This is a mistake. Wobble is defined as an irregular (e.g.) action. The effect at the heart of the g-2 experiment is far from irregular. In fact it is extremely regular, so regular that it can be measured to an incredible level of precision. Without that level of precision the experiment would be useless to look at the phenomena involved. The use of a term that has irregularity at its heart in a story about extreme precision produces a level of cognitive confusion that cannot help but cause confusion. I suspect that most people don't realize that this confusion is an issue but I've seen this effect in many cases where the popular treatment of a subject produces lots of misunderstandings.
The second issue is more interesting. This experiment, if confirmed, reveals that our theories fail to accurately predict experiments. But the more interesting question is: What will fix this error? Every story, including the one I linked to above, says that this experiment may be pointing to the existence of unknown particles or forces that aren't included in the Standard Model. This is true but it ignores what I think is a far more exciting possibility.
If we look back at the history of physics, when there have been mismatches between theory and experiment, there are two different kinds of changes that were made to our theories. The first kind of change leaves the basic theory unchanged but changes some details like the contents of list of particles. In the Standard Model calculations that go into the theoretical predictions of g-2, every type of particle needs to be considered. The second kind of change to our theories is different. Rather then keeping the basic structure of the theory unchanged and changing the details, this possibility involves an entirely new theory.
An example, that is probably familiar to most readers of this blog, involves planetary motion. The details aren't important here but a detail of Mercury's orbit wasn't being predicted correctly by Newton's Law of Universal Gravitation. Previously, errors were noticed in the orbit of Uranus. Those could be eliminated if another planet was out there and this lead to discovery of Neptune. This was an example of the first class I'm talking about. In the case of Mercury the problem wasn't a missing input in our theory. The problem was that Newton's theory of gravity needed to be replaced by Einstein's. In the limit of small masses and low velocities Einstein's theory gives the same results as Newton's. But the theories are fundamentally different. They use an entirely different set of concepts to model reality. This new theory caused a fundamental shift in the scientific view of the cosmos and the birth of major new fields of science.
I don't have any reason to think that a new theory, one that reduces to the Standard Model in some limit like General Relativity reduces to Newtonian gravity, is going to be what is needed to explain the results of the Fermilab Muon g-2 experiments. But that is a possibility that shouldn't be ignored, instead I think it should be embraced. Who knows what wonderous changes it will produce in our view of reality?