Friday, October 16, 2020

Tides, Black Holes, and Science "Journalism"

 Recently a paper was published giving the results of a series of observations of a star being torn apart by a supermassive black hole. The event was interesting for many reasons including the fact that it was the nearest such event yet seen and it was noticed early enough so that it was observed in many different ways from the radio to x-rays and these observations followed the evolution of this object for an extended period of time as it both brightened and dimmed.

The popular press published several articles about this event, AT2019qiz, and these observations. In virtually every case they misrepresented several phenomena and added to the already significant confusion most people have regarding, not only black holes, but one of the most widely misunderstood yet seemingly familiar concepts from physics. Tides.

On Tuesday Jan. 4, 2011 David Silverman was on the O'Reilly Factor and the host, displaying an astounding depth of ignorance asserted that tides could not be explained. This resulted in (at least) two interesting results. One, based on the dumbfounded expression on Mr. Silverman's face, is a popular WTF meme.


The other was a large number of "explanations" of tides that appeared to refute this silly statement by O'Reilly. One of which is well characterized by H.L. Mencken oft quoted quip; "neat, plausible, and wrong", delivered by Neil deGrasse Tyson on The Colbert Report. The "mechanism" described would only produce tides once per day. I have no doubt that Dr. Tyson knows what causes the tides. I suspect he did what he thought was the best he could in the time allotted to explain. But none of the explanations actually did a good job. The best one I've seen is far too long for most situations but it has the advantage of actually being correct. I strongly suggest that you follow the link and watch the video now. But understanding tides is only part of the story here so please return.

This relates to black holes because their powerful gravitational fields can produce truly monstrous tidal forces that would tear you apart long before you crossed the event horizon. Steven Hawking popularized a term for this effect when describing what happens when you approach a black hole the mass of the Sun. He wrote that you would be stretched out like spaghetti, or as it is now often called, you would be undergo spaghettification. 

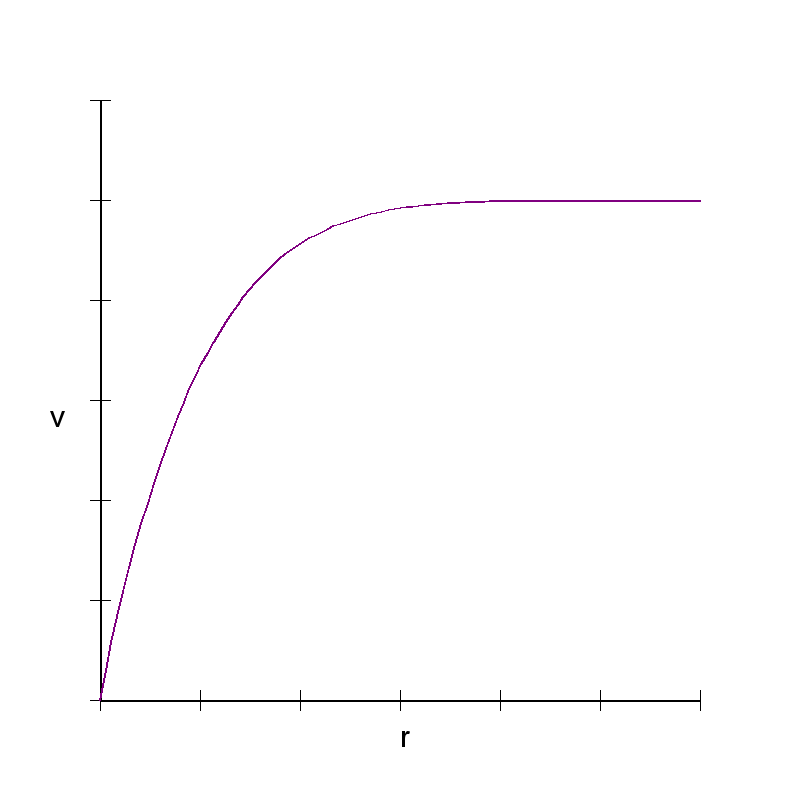
Let's define some terms. To keep things simpler I'm going to consider the case of the simplest kind of black hole: One that isn't spinning. The closer you get to a mass the higher the escape velocity. A black hole can be defined as any place where the escape velocity exceeds that speed of light. The formula using mass and distance where this happens in Einstein's General Relativity was first computed by Karl Schwarzschild  so it is called the Schwarzschild radius (Rs). The boundary of space that is Rs away from the center of a black hole is called the "event horizon". Black holes have been detected in a large range of masses. At one end are ones that are just a few times the mass of our Sun. In the typical style of astronomical nomenclature these are called "stellar mass black holes". At the other end are the huge behemoths found at the center of most galaxies. These are typically millions to billions times the mass of our Sun and are called "supermassive black holes" (SMBH)

As Hawking pointed out in his book, as the mass of a black hole increases the tidal forces at Rs decrease. For SMBHs the tidal forces at this critical location are too small to notice. Spaghettification does not occur for SMBHs. To be precise I'm only considering things outside of Rs, once closer than that you're doomed. 

Let's look at a few actual examples. Consider a one solar mass black hole. At the event horizon a 6ft tall person falling feet first would have their feet accelerated away from their head at about 1 million times the acceleration we experience on the surface of Earth. But it is even worse than this makes it look. Not only are you being stretched out, you would also be crushed from the side. So it is like being extruded through a press, like the way pasta is made. What about large black holes? For a SMBH like the one at the center of our galaxy the effect would be about 1018 times smaller, essentially zero. Going back to the one solar mass case you would need to be about 40*Rs away before the tidal forces are only as large as gravity on Earth. 

"Spaghettification" was used in every popular article I saw on AT2019qiz. The first article on this event that I saw posted by a friend on Facebook was this one. It starts very well by pointing out the popular misconception that black holes are cosmic vacuum cleaners. This is true, up to a point. At close distances black holes orbits are not possible. The article then makes up for this by asserting that it is only material that crosses the event horizon that is trapped. This is off by at least a factor of 3. Within 3*Rs no stable circular orbits are possible for anything other than light (and other massless particles) and anything closer will be swallowed up. 

It then says "If that object is a star, the process of being shredded (or "spaghettified") by the powerful gravitational forces of a black hole occurs outside the event horizon, and part of the star's original mass is ejected violently outward. This in turn can form a rotating ring of matter (aka an accretion disk) around the black hole that emits powerful X-rays and visible light. Those jets are one way astronomers can indirectly infer the presence of a black hole."

The issue of whether the spaghettification occurs inside or outside of the event horizon is determined by the mass of the black hole, not the mass of the object falling in. So the fact that we are talking about a star doesn't matter. It is true that part of the star will be ejected "violently outward" but this isn't what causes the formation of the accretion disk, it is caused by it. The rest of the excerpt confuses the accretion disk with the jets and where the various emissions come from. It is probably easier to see what a more accurate description would be:

If a star gets too close to a SMBH the tidal forces will disrupt it into stream of hot gas. This is appropriately called a TDE (tidal disruption event) and occurs outside of the event horizon. The strange orbits caused by being so close to the black hole cause the stream to run into itself and flatten out, forming an accretion disk. These interactions are so violent that the disk is hot enough to glow not only in visible light but even in X-rays. In addition accretion disks also create powerful jets that point perpendicular to the disk, although the details of how this works isn't currently well understood. The power of these jets is often used to infer the presence of a black hole.

The preceding paragraph covers the same material as the excerpt from the article without the errors, explains, or at least introduces some of the more interesting physics, and doesn't require any more science knowledge of the reader.

This was an important paper for very technical reasons that are essentially impossible to explain. Wisely, none of the articles I saw tried to do this accurately. Instead they confused the concepts of TDE and spaghettification and got the physics of black holes, accretion disks, and jets wrong all while missing the opportunity this presented to explain these, and other, concepts correctly. 


Friday, September 18, 2020

Thorium Reactors: An Incomplete Overview

The subject of Thorium reactors keeps coming up and there are always serious errors and misconceptions in almost every treatment. These problems are often not caused by special characteristics of Thorium reactors but a lack of background in the science behind the entire subject. That is too large a topic to treat in a single post so I'm not going to even try. Much as it pains me to do so when such issues arise, here I will just state conclusions without backing them up.

What follows, as indicated in the title, is a general overview of thorium reactors with special attention to some of the more common errors and misconceptions.

For some background I'll start with a very high level description of thorium reactors. They are devices that use nuclear fission to release large amounts of energy that is converted to electricity by producing steam to drive turbines. Nuclear fission is the process where a large nucleus breaks apart, usually into 2 unequal pieces and a few neutrons. Usually this is caused by the absorption of a neutron. The neutrons then go on to hit other nuclei causing them to fission as well. In a few cases the number of neutrons is large enough, and the likelihood that absorbing a neutron will produce fission is high enough, that a chain reaction will occur. Such materials are called "fissile".

Another important classification is "fertile" substances. When these absorb a neutron they are, usually after a series of decays, converted to a fissile substance. The fissile material in a thorium reactor is 233U, an isotope of uranium. This does not exist in significant quantities in nature so it is produced in the reactor itself from 232Th which is fertile. Reactors like this, where neutrons are used both to produce fission and to breed new fuel, are called breeder reactors.

There are a few general categories that cover the most egregious problems in treatments of thorium reactors:
Reactor Safety v Fuel Choice
Reactor Design v Fuel Choice
The effect of fuel choice on waste
Misinformation
I'll take them in reverse order.

One of the errors that motivated me to write this was a misstatement of the half-life (the time it takes for ½ of the material to decay) of thorium. Thorium on Earth is 99.98% 232Th. This isotope has a half-life of around the age of the Universe, 14 billion years. I've seen assertions that thorium's half-life was short, on the order of dozens of years. I've also seen assertions that its half-life is MUCH longer than it is. I'm a bit troubled by these errors because the real number is so easy to find. I've also seen the assertion that since thorium doesn't need to be enriched it is less useful as a source of nuclear weapons material. This is wrong in multiple ways.

I also commonly see that the only reason thorium reactors weren't developed is that they don't produce material for nuclear weapons. It is true that thorium reactors don't easily produce weapons grade material but neither do any reactors that are designed for power production. Weapons material is produced in reactors optimized for that purpose, in the case of plutonium. In the case of uranium this done with centrifuges. Using the waste, or partly spent fuel, from a power reactor would be a difficult way to make weapons grade material. A significant design restraint of early non weapon producing reactor systems was to power submarines. Uranium is a far better choice than thorium for this. The relative likelihoods of alternate histories are difficult to quantify but, that's one of the major reasons that things worked out as they have. Another factor is a detail in the breeding of 233U that caused Enrico Fermi, one of the major figures in the development of nuclear technology, to disfavor thorium. A solution to this problem was found but not until attention had focused on other paths.

Much of the discussion around nuclear reactors in general is really about the waste produced. Much of that discussion is based on several misunderstandings about radiation and the health dangers associated with it. As I said above I'm not going to even try to explain my conclusions but here's the bottom line. The idea that radioactive materials must be sequestered until their emissions can't be detected is silly. We live on a radioactive planet. Even more radiation is added from space. From a health point of view it is clear that the amount of background radiation we get from the average location on Earth is not a significant health risk. Many evaluations of the danger of nuclear waste are based on ignoring this fact. This is true of all nuclear reactors, no matter what fuel is used.

It is often stated that the waste problem from thorium reactors is less dangerous. One specific claim is the assertion that thorium reactors produce waste that is less radioactive, with the implication that this makes it less dangerous. The first problem with this is that it isn’t true. The waste produced by Thorium reactors is more radioactive than from existing reactors. But this turns out to be a good thing.

The major issue surrounding nuclear waste is that it needs to be kept secure until the radiation gets to an acceptable level. As mentioned above, there is disagreement about what that acceptable level is. But there is no disagreement that the important characteristic is the half-life of the material. Let’s say you have a particular number of atoms of a radioactive material. If they decay in a short time there will be lots of radiation produced in that short time. So a short half-life means a highly radioactive substance. The longer the half-life the longer it needs to be sequestered to allow it to decay away. So, from a waste sequestration point of view, highly radioactive material is better than lower levels of radioactivity. The facts here are good for thorium reactors.

The core of an operating nuclear power plant has three classes of materials:
1) The fuel itself.
2) Substances created when the fuel fissions, called fission byproducts. These have half-lives ranging from tiny fractions of a second to around 10 million years.
3) Substances formed as the result of unwanted nuclear reactions. The most important of these are mostly elements in the actinide series of the Periodic Table these are called actinides. These have half-lives ranging from around 6 to several billion years. Thorium reactors create less actinide waste. It should be noted however that thorium reactors still produce waste products with very long half-lives, up to about 17 million years, but only in quite small amounts. This is contrary to the commonly seen assertion that no such waste is produced in thorium reactors.

However, if we take a sensible approach to how long radioactive materials need to be isolated thorium reactors are a big improvement. The reduction in the creation of actinides is the primary reason for this. Despite the existence of some long lived substances, the waste from a thorium reactor is about as radioactive as naturally occurring ore in only a few hundred years as opposed to many thousands for current designs.

Another issue is the overall design of the reactor. For this discussion I'm referring to a very basic question: Is the fuel solid or liquid? For technical reasons beyond the scope of this treatment thorium reactors are best implemented as liquid fueled or Molten Salt Reactors (MSR). In particular reactors that use molten fluoride salts known as Liquid Fluoride Thorium Reactors (LFTRs) are the ones getting the most attention. It is important to realize that MSR reactors can be operated with any of the nuclear fuel cycles that have been studied. MSR reactors are more complicated than current LWR designs but they have several advantages. Most of the advantages cited for thorium reactors such as more complete utilization of fuel are actually benefits of being a MSR and unrelated to the use of thorium as a fuel.

One of the most common misrepresentations in this category is that a LFTR was built in the early days of nuclear reactor development. This is NOT true. An MSR was built and for a time it was fueled with the same isotope of uranium that fissions in a LFTR. The second step, the breeding of the fuel was also demonstrated, but in a different reactor. This is valuable experimental verification that a LTFR might be a workable design but no LFTR was actually built. This misinformation is used to present LFTRs as proven design that is ready to commercial use.

The danger of a meltdown is probably the best known and most common concern with nuclear reactors. A meltdown occurs when the energy produced in the reactor isn't removed fast enough and it heats up to the point that the physical structure is damaged or destroyed allowing the highly radioactive fission byproducts to escape. The basic design of a LFTR makes it very easy to ensure that this cannot happen. This is often mentioned as an advantage of thorium reactors. This is wrong for at least two reasons. First, all MSRs share this characteristic. This is true no matter what nuclear fuel was used in the reactor. Second, it is also possible to design a solid fueled uranium reactor, very much like current reactors, that is inherently extremely resistant to meltdown.

In conclusion, much of the information about thorium reactors that you’re likely to run across is wrong. But it is true that thorium reactors, LFTRs in particular, are an interesting technology with many potential benefits that show lots of promise and they address the reasonable concerns with current commercial reactors. However many of those benefits are not because they use thorium and can be applied to reactors that of multiple designs and fuel choices. Nuclear reactors are likely to be central in any successful attempt to combat climate change. Thorium reactors, LFTRs in particular, are a particularly promising approach.


Thursday, July 30, 2020

Caustics, Coffee Cups, and Rainbows

There are many explanations for rainbows available online. Most give a good basic description but there is one central aspect that none of the popular treatments explain. I've only seen one that even mentions it, this video from Physics Girl. It might be a good idea to watch that video if you don't remember the usual rainbow discussion. The video explains why the usual explanation is incomplete but doesn't take the next step. So here's my attempt to fill that gap.
Like many words, "caustic" has a variety of meanings. All seem to go back to both Latin and Greek where the word refers to burning. In the context of this post it refers to the concentration of light that is caused by reflection or refraction for any curved surface. A glass sphere in the sun could burn the table it was resting on which gives the motivation for the use of the word "caustic". Most have us have seen this is the bottom of a cup or glass.


A similar thing happens when light bounces around in a raindrop. The diagram below shows a ray of light entering the water drop some distance away from the center, It hits at what we will is refracted call the incident angle i and refracted to a path at the refracted angle r. This refraction depends on the color of the light so the angles are a bit different for different colors. It then hits the back of the drop and reflects at the same angle r and travels to the front of the drop and exits at an angle i. The light isn't reflected straight back but it is deflected by an angle φ. It isn't too hard to see that φ=4*r-2*i.


So we get light coming out of the raindrop at an angle that depends on where it went in to the drop and the color of the light. But what about light that didn't enter at just the right spot? Here's an image that shows the paths of many different rays.


We can see that there is a maximum angle of deflection but it is hard to tell what is really going on. To get a better idea let's take a look from further away from the rain drop.


Now we can see that not only is there a maximum deflection angle but there is a concentration of rays around the maximum deflection. The next image shows the relative amount of light sent back from a raindrop taking the refraction and the geometry of the raindrop into consideration.


The distribution is very sharply peaked at the maximum possible deviation. Like the caustic on the bottom of the cup shown above most of the light is concentrated at the edge of the pattern. As mentioned above the amount of deviation depends on the color of the light so what we get it nearly all of the light at a particular color being deflected into that very sharp peak. Each color of light forms a ring as seen by the observer of all the raindrops that are in the right position and the result is a rainbow.

Wednesday, July 8, 2020

The Dangerous (?) Appeal of Whiz Bang

A friend posted a video about masks, how they worked, and why that was important for reducing the spread of COVID-19 and the virus that causes it. I'm not going to link to the video for reasons that I hope will be obvious.

The video is on a YouTube channel that I haven't looked at carefully but I've seen a few things on it that were pretty good so I was hopeful that this would be as well. The Whiz Bang I referred to in the title of this post is Schlieren photography. In this case made even more Whiz Bang by being slow motion video. There were really slow-mo videos of the air flow caused by talking, breathing, or coughing both with and without a mask. There is an obvious difference made by the mask, a very large reduction in the patterns made visible by the Schlieren setup. The video states that this will allow us to see "if masks really do help to stop the spread of coronavirus". But that is simply untrue. Schlieren photography allows us to see tiny variations in the index of refraction of air usually caused by turbulence. It does NOT allow us to see particles or aerosols which is what would be needed to support the claim I quoted. There is even an image in the video that shows the Schlieren patterns formed in front of different kinds of face coverings. The one with the most obvious patterns is an N95 mask. By the "logic" of this video that would mean that the N95 is the least effective at preventing viral spread and that is simply untrue.

The segment of the video about the Schlieren setup was followed by a longer section that covered lots of ground about how masks work, how the virus spreads, and how those things interact so that masks help stop the spread. There were LOTS of assertions made and they ranged from clearly correct to absurdly wrong. I'm not going to go into any detail on this for several reasons. First, there are simply too many for me to handle in any useful way. Second, I'm not an expert in many of the fields that were covered by these assertions so although I'm pretty sure they are wrong I can't back that up without more time than each assertion is worth.

The visual impact of the Schlieren imaging and the emotional appeal of that example of "Whiz Bang" will make the misinformation more likely to lodge in the minds of viewers.

Friday, April 17, 2020

Trig Functions: A Better Introduction

One of the things I really don't understand is the terrible way that trig functions are introduced. The definitions given are all ratios of the sides of a right triangle. This does give the correct answers but it completely masks the meaning behind the words and obscures some simple ways to understand what is going on.

First, the word Trigonometry means triangle measurement. The value of all of the trig functions can be determined with a ruler by direct measurement. To see what I mean by this let's start very differently from the way you were probably taught: the Tangent function.

First we draw a circle with a radius of one unit, the horizontal axis, and a vertical line tangent at the right edge, like this:


Now draw a line from the center at the angle of interest relative to the horizontal axis out past the tangent line, like this:


The tangent of this angle is the length along the *tangent* line between the horizontal axis and the radial line, the red part shown here:


This is why that value is called the tangent. No dividing or other computation need to be done. Just measure the length.

The word "secant" comes from the Latin word for cut. The length from the center along the radial line that "cuts" through the diagram till the vertical line is the secant of this angle. It's shown in green here:


If we look at the arc of the inside of the circle between the radius and the horizontal line get the last of the basic trig functions. The Latin word for bay is "sinus". The sine of that angle is half the chord of the circle from the intersection of the line and the circle. This diagram makes that clear. The sine of the angle is shown in blue, here:


These are the three basic trig functions: Sine, Secant, and Tangent.  Here are all three of them on one diagram.


The other three are based on the idea of a complementary angle. The complementary angle is the angle that when added to the original angle is 90°. This is the angle between the slanted line and the vertical. So if we add a tangent line at the top of the circle and a y-axis the we can find the corresponding lengths for these three complementary functions. The sine of the complementary angle is defined as the cosine. The other functions, cosecant and cotangent are obvious at this point. I'll use dashed lines of the same color. The dashed blue line is the cosine, the cosecant is the green plus the dashed green, and the red one the cotangent.


These can be shown to be equal to the textbook definitions pretty easily. To make this match the textbooks I'll switch to the standard 3 letter forms:
sin=sine
sec=secant
tan=tangent
cos=cosine
csc=cosecant
cot=cotangent

We can see that sin/cos=tan by looking at these two similar triangles.


The smaller triangle is clearly similar to the larger one because all three angles are the same. Note that the base of the smaller triangle is the same length as the dashed blue line. For the larger one the ratio of the sides that aren't the hypotenuse is the length of the red line to the radius of the circle which is 1: tan/1=tan. For the smaller one that ratio is sin/cos so we get that sin/cos=tan.

Looking at the same two triangles we see that the ratio of the hypotenuse to the horizontal side of the smaller one is 1/cos. For the larger one it is sec/1 so we get the 1/cos=sec

Looking at the next two triangles we see that the ratio of the hypotenuse to the vertical side of the smaller one is 1/sin. For the larger one it is csc/1 so we get the 1/sin=csc


The most cited trig identity sin2+cos2 = 1. This can be read off the diagram by looking at this triangle and using the Pythagorean equation. The square of the hypotenuse (which is just 12 or 1) is equal to the sum of the squares of the other two sides.


Similarly this shows that 1+tan2=sec2


And 1+cot2=csc2 is shown here:


I think that this is a far better way to introduce the trig functions. It motivates the names, allows simple constructions for the simple relationships between them, and is easier to remember.

Thursday, April 16, 2020

Science, Lift, and understanding

A while ago Scientific American published an online article whose title asserted "No One Can Explain Why Planes Stay In The Air". This made quite a stir and there were a lot of responses to it, most repeating or confirming an assertion slightly different than that title. Namely, "Science doesn't understand why planes fly". This is wrong for at least two reasons. First, coming to this expanded conclusion requires a profound misunderstanding of what science is. Second, the problems cited in this article are a misrepresentation of the actual "problem" in the (incorrect) textbook explanation and the gaps that still remain in our understanding of aerodynamics. I'll consider these in order.

First, what does it mean to say the "science" "understands" something? It does NOT mean that there is an explanation that will produce a feeling of intellectual satisfaction in even the most naive person. Some particularly simple things can be explained to this level but not many. There is almost always some amount of background needed to understand what the scientific answer involves.

It would be nice if this weren't the case. Then our intuition would be a reliable guide to understanding the natural world. But it isn't. That's why we have science, that's why we need science. Science works by making testable models of the physical world that accurately predict the outcome of experiments. This is clearly not understood by the writer of the SciAm piece which contains this rather shocking statement " ... by themselves, equations are not explanations ...". This could not be further from the truth.

When a set of equations allow a wide range of phenomena to be accurately predicted we say that science has explained this aspect of nature. There is little in science that our built in intuitions can actually fully embrace. That doesn't mean that science has failed to explain it, it means that we are using the wrong metric to evaluate that explanation.

Second, what are the shortcomings of the standard explanations of flight and how well do the complete models predict the results of experiment. There are two widely proclaimed "explanations" of lift. The Bernoulli explanation and the Newton explanation.

The first is the one in most textbooks. It says that if a small volume of air hits the front of the wing it will split in two and part will go over the wing and part will go under and meet up at the back of the wing. Since the top of the wing is curved that path is longer so the air on top of the wing is moving faster. The Bernoulli effect tells us that faster moving air has a lower pressure so the pressure is higher at the bottom than the top to the wing produces lift. This is almost certainly what you were taught at some time in school.

The most common alternative says that the angle of the wing pushes the air down so by Newton's third law the action of pushing the air down produces a reaction of lifting the wing up.

The Bernoulli explanation has a number of problems. The central assumption that the two parts of the initial volume of air meet up at the back of the wing is simply assumed without explanation. And even worse, that assumption is dead wrong. If you study the airflow over a wing the air going over the top reaches the back of the wing well before the air going under.

The second one is correct in what it states but in this form misrepresents the subject as extremely simple. In reality it isn't quite this bad because every example I've seen includes a statement like: There are lots of other details but this is the dominant effect. The main problem with the approach is that it tells us nothing about the details of the airflow. It doesn't tell us why the air is deflected down.

Neither of these have enough detail to qualify as scientific explanations as I described above since they lack a way to predict an amount of lift that can be compared in detail to experiment. They both succeed at the hand-waving level though. The Bernoulli explanation predicts that a curved airfoil will work better than a flat one and that's often true. The Newton one predicts that lift will increase with a higher tilt to the wing which is also true within some range of conditions.

So what's the real deal? A full treatment is beyond the scope of a blog post and beyond my understanding of the topic. But I can sketch out the ingredients and make enough connections to give what I hope is a cogent picture.

We need to start with a disclaimer. This will not, and can not, be a "complete" description. Air moving past a wing is a collection of an enormous number of individual molecules. The way these molecules act under all circumstances is far too complex to be well and reasonably completely understood because we simply don't have the ability to track all of the details of each molecule of ANY but the very smallest of things. This means that approximations must be used that will result in some details being lost.

The basic assumption is that the air will be considered to be a fluid. Everything I said about air is also true about fluids but we have an intuitive concept of a fluid as a continuous substance NOT made of individual particles. We need only consider the bulk properties to know everything the model can tell us about the fluid and this is enough for almost any situation. In technical terms this problem is solved using an analysis tool called Computational Fluid Dynamics and as grandiose as that sounds the reality is both more complex and the power even greater. For this case we just need to know the density, pressure, and velocity at any point. So don't expect a "complete" explanation. That is unreasonable. But as we increase the number of parameters that we pay attention to we can capture any aspect that is required.

Let's look at some actual cases. I'm using the software from the NASA Glenn Research Center. This software uses takes into account the most important considerations in fluid flow. For simplicity we'll take a look at a symmetrical airfoil parallel to the airflow. The image shows the way air flows past the airfoil as dashes with the speed of the air shown as the length of the dash. Each set of lines shows the motion of a equal amount of air.


What can we tell from this? The dash at the left (leading) edge of the wing is shorter than all of the rest. This tells us the moving slower. The dashes about 2/3 of the way back are the longest and this shows the higher speed at these points. We can also get pressure information from this software but not on the wing graphic. But the Bernoulli Principle tells us what we need to know. Where the speed of the air is low the pressure is high and where velocity is high pressure is low. What is happening here is pretty simple. As the air moves toward the wing it is compressed because it's motion is blocked by the wing. Also the flow lines are closer together near the wing. They have to be because the same number of flow lines are present at each point along the horizontal in the diagram. Since the wing is present the flow lines get bunched. Since same amount of air is the along each flow line to get the same amount of material through a smaller space it must be moving faster.

Here's what happens when that same shape is tilted up by 5 degrees.


Again the highest pressure is at the front and it is lowest about 2/3 of the way back. But you can see that the air is moving much faster across the top of the wing then the bottom. This means that the pressure is lower on the top than the bottom so we have lift.

That sounds a lot like the Bernoulli explanation, if you ignore the fact that the whole motivation given in the textbooks is wrong.  I've presented these two as alternatives because that's the way it is usually portrayed. But that's a big mistake. A better way the look at is to see detailed use fluid dynamics to determine how the flow of is disturbed by the wing. We can either look at the net change in air flow and use or Newton's laws to see what forces are involved OR compute the pressure on the different parts of the wing and get the net force. These are just two different ways to get the same answer and which one is used depends on what we are looking at. If we are considering the details of flow around the wing is makes the most sense to look at it from the Bernoulli point of view. But to figure what that means to the entire plane we need to consider it from the Newton view. On the other hand if we are looking at the motions induced in the air caused by the plane than using the Newton view makes the most sense. Of course to actually compute it you need to consider the Bernoulli effect in all of it's glory.

If you'd like more detail I suggest taking a look here for a more complete treatment.

In conclusion; we DO understand why planes stay in the air. Our understanding is a scientific one that acknowledges the limitations of both ourselves and our tools but they can be made as precise as we need. Perhaps the entire problem could be avoided if the author of that SciAm article had used the title "I Can Not Explain Why Planes Stay In The Air". That would have been correct.

Tuesday, April 14, 2020

The Most Misunderstood Hubble image

There is a beautiful set of images from the Hubble Space Telescope (HST) that are almost always described as an explosion. Here's a video assembled from those images. It is strikingly beautiful and it certainly LOOKS like an explosion.


But it isn't. The first clue that there is something "funny" going on here is the time scale involved. Let's take a look at the first four individual images used to make that video.


Taking into account the distance to this star, between the first and last of these four images that size of that "ring" has grown from 4 to 7 light-years. Growing 3 light years in 7 months raises (or at least should raise) some very large red flags. So what's going on here?

This is what is known as a light echo. So, what is that? Imagine a huge diffuse cloud of dust with a very bright flash bulb nearby. When the bulb goes off it will send light in all directions. The light that goes towards the observer will get there first and be seen as a bright dot. What happens to light that goes in other directions? It will illuminate the dust in a spherical shell moving off at the speed of light. At anytime after the flash, until the light moves past the dust cloud, the light will scatter in all directions. Some of that light will scatter towards the observer. That light forms a light echo. This has been seen in before astronomical settings but none have been so beautifully imaged as this series of images from HST.

The shape and development of a light echo depends on the distribution of dust around the light source. Taking into account the way light is scattered by the very small particles typical of interstellar dust the likely distribution of dust for this light echo has been modeled and found to be a plane of dust in front of the star.

To get an idea of what that will look like let's consider a very simple situation. A thin sheet of dust in front of a source a bright flash. Imagine looking at this from another vantage point. If the flash is a the center of the field and the original vantage point is far away to the left. That's shown in the animation below. The sheet of dust looks like a line and it's brightly light where the shell of light intersects it.


From the original vantage we'll see an expanding ring at the intersections of the shell of light and the sheet of dust. Since the light from the flash is farther to the left it gets to the observer before the light from the ring. So what's seen is a flash followed by a ring expanding away at a very high speed.

This is enough to understand why we a roughly circular bright ring growing very quickly. In detail the situation is more complicated. Proceed with CAUTION.

Again we look at the star with the original observer far away to the left. What would happen to a light beam that went directly away from the observer and traveled for a distance h before it hit some dust and then was scattered back to the observer as shown in the diagram below?


This would arrive at a time t=2hc, after that flash. What other beams would reach the observer at the same time? Here's an animation that shows this in action.


So what shape is traced out by all these point? If the object is far enough away the light from anywhere in the same telescope field will be travelling parallel so we can see that these points will be the ones that are the same distance from the source as they are from a plane at a distance 2hc behind the star. If you remember your conic section geometry you'll recognize that this defines a parabola. For every time after the flash the locations of the points that can scatter light back so that they reach the observer at the same time are on a parabola. Here's an animation that shows how that changes over time.


The time evolution of the apparent image will depend on the dust density along this paraboloid and the way that dusts scatters at the angles involved.

Tuesday, February 11, 2020

Rotation Curves and Dark Matter

There has been a lot of talk about dark matter for quite a while now and this has seen a recent uptick for many reasons. The LSST (Large Synoptic Survey Telescope) has been named the the Vera C. Rubin Observatory. Her discovery that the rotation curves of galaxies are not explained by the matter that we can see is both widely known and widely misunderstood. The physics is actually not that hard and I am at a loss to explain why it is so poorly understood by so many people that are quite scientifically sophisticated. There are several places that this is explained on the web but apparently they aren't doing it so I'll give it a try. What follows has equations but no (well almost no) calculus so I hope it is accessible to most readers of this blog. If this isn't the case please contact me at this email address.

So, what is a rotation curve? It is the shape of the graph we get when we look at how fast portions of a collection move when that collection is rotating. Let's consider three examples. First, rotation as a solid body, a disk, or if you are old enough to remember seeing one, a record. The distance along an arc is just the angle moved times the radius so the velocity is just the angular velocity times the radius. This gives as a rotation curve that is a straight line.
Next let's consider a system of planets orbiting around a central star.We start with Newton's equation for gravity, F=GMm/r2 and the equation for centrifugal force, F=mv2/r. Here M is the mass of the star, m is the mass of the planet and r is the distance. To be stable the two forces must be equal so we set these equal and do a bit of algebra and ignore the M and G because those things don't change and we get that v is proportional to 1/√r. That curve looks like this:
A bit of a diversion for some important information is needed before we go further and this is the most technical part so be prepared. There is a beautiful theorem, first proved by Newton, called the Shell Theorem. It states that for a point outside a spherically symmetric shell (like a perfect soap bubble) of matter of uniform density, the gravity is exactly the same as if all of the mass were concentrated at the center. A bit more surprising is that from *anywhere* on the inside the gravitational force is zero. Everything balances and cancels out. The most common proof of this is done using calculus which is why I said that post would *almost* be calculus free. Newton didn't quite use calculus and a fully geometrical proof also exists.

Let's say you are in a near a spherical collection of uniformly distributed stars. From the outside the gravity could be considered to be due to the total mass of the collection right at the center. For a point inside we can ignore everything outside and consider only the material inside and again concentrated at the center. If you'd like a slightly different approach take a look at this video where the gravity at various points *inside* the Earth is considered.

Armed with this let's now consider stars in a spiral galaxy. What should we measure when we look at the speed of stars in a spiral galaxy? The stars near the center are inside of the visible bulk of the galaxy so they are subject only to the gravitational force of the stars closer to the center which are a small fraction of the mass of the galaxy. Those stars should rotate slowly. As we go further out the stars are subject to gravity of more and more stars so their velocity should increase. Once we get past the central bulge of the galaxy the amount of material that is added when we increase distance rapidly decreases so that eventually almost all of the mass in interior to the star's orbit so the curve should resemble the downward curve for the solar system. We expect something like this:
However, when Vera Rubin looked at the Andromeda galaxy she saw something like this (idealized) graph:
As expected the curve rose as more of the dense central region of the galaxy was involved in holding the stars in orbit. But, rather than dropping off as you would think looking at the visible objects it remained at about that level. What does this tell us? First it tells us that the stars aren't a good indicator of the amount of gravitating material there is in the galaxy. To be more specific, since the curve is flat once we get outside of the central bulge of the galaxy we can use the equations above to see how much mass there is as we move away from the center of the galaxy. Remember that the formula for the force of gravity is F=GMm/r2 but now we want to see how the gravitating mass should change with distance so we write  F=GM(r)m/r2 and set it equal as the other formula as we did above F=mv2 /r. After a bit if algebra where we get rid of the things that are taken to be constant we get that M(r)∝r. The rotation curve is telling us that as we go well past the most of the visible parts of the galaxy we continue to see the effect of mass that increases with the radius. Since the volume of a sphere increases as the cube of the radius that means the density of the material is dropping of as 1/r2

Since the dark matter halo that galaxies are embedded in are so much larger than the visible parts we can't use this information to determine the shape and density of these haloes toward their outer edges. It is likely that, if we could see material out much further than we can in real galaxies that the rotation curves would drop indicating that after some distance there was very little additional matter.

This is being investigated in at least two ways. One is large scale numerical simulations of the evolution of the universe taking into account all of the physics we know. These are very difficult and are limited by the amount of computation power and memory available but they are getting consistent result that look a lot like our real universe. This indicates that we aren't likely to be missing anything big. The other is more observations of galaxies with two new telescopes LSST and WFIRST which will look at the effects of dark matter by observing the way the light of very distant object is gravitationally lensed by dark matter surrounding nearer objects.

Saturday, February 1, 2020

The eVscope

This post is going to be a bit different than the others on this blog but it does relate to people getting stuff wrong :-)

A while ago I was told about a new amateur astronomical instrument that was essentially an automatic camera that had an eyepiece built in so you could see the image in a similar way to using a telescope but have the advantages of modern solid-state sensors and image processing. As a long time amateur astronomer I have long wondered why it felt so different to look through an eyepiece and see a faint gray object as opposed to seeing an image on a page or a screen of the same thing with far more detail and often in color. There is, at least to me, a certain feeling that made looking at the object more emotionally satisfying than looking at an image. I didn't know if it was the immediacy of the eyepiece, the knowledge that it was my eye that was absorbing the light, or something else but the difference was very real and quite significant.

So what would it be like to view an object through an eyepiece but be looking not at the telescopically gathered light but at an image that was formed by that light. I had a guess that it would feel like looking at a screen. I jumped at the chance to find out and I was wrong. It felt like looking through a scope. Perhaps it was the fact that my eye was focussed for infinity(or as close as my near-sighted vision allows). The first object I saw was one that I have seen many times in telescope, M 57 or the Ring Nebula. In a telescope it is a small, faint, colorless ghostly smoke ring. In the eVscope it was bright, obvious, and colorful. An amazing sight.

I was so impressed that I did a short promotional video for the Kickstarter campaign which I also backed. This had a side effect that I didn't anticipate. One of the "features" of our modern world are people that are often called YouTubers and a some of them spend a significant fraction of their time doing takedowns of things and ideas that they determine are worthy of such treatment. One of these people did an "EVSCOPE BUSTED" video that included a piece of my promotional video. Some friends of mine let me know about it so I watched.

The video is a mix of lots of elements. Much of what was "busted" was a strawman, some of which might just be misunderstanding. But one particular aspect is the reason for this post. The YouTuber apparently had the same initial reaction I did to the idea of the eVscope and, like me, assumed that it wouldn't "feel" like looking through scope. Several times in the video it was clearly and confidently stated that this would not be like looking through a scope. The kicker is that I'm quite certain that this position was reached without ever trying one. Without ever seeing one. There were also a large number of other assertions made without actually trying the device which are sometimes spectacularly wrong.